Page 2 - Oscilloscopes
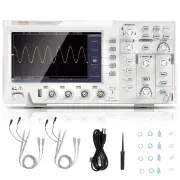
2 MODEL NO.: SDS1102 Have product questions? Need technical support? Please feel free tocontact us: Technical Support and E-Warranty Certificate www.vevor.com/support NEED HELP? CONTACT US! This is the original instruction, please read all manual instructions carefully before operating. VEVOR reserv...
Page 3 - Table of Contents; Advanced User Guidebook
3 Table of Contents 1. General Safety Requirements ................................................... 52. Safety Terms and Symbols ...............................................................7 3. Quick Start ...........................................................................................
Page 5 - General Safety Requirements
5 1. General Safety Requirements Before use, please read the following safety precautions to avoid any possible bodily injury and to prevent this product or any other connected products from damage. To avoid any contingent danger, ensure this product is only used within the ranges specified.Only a q...
Page 7 - Safety Terms and Symbols
7 2. Safety Terms and Symbols Safety Terms Terms in this manual ( The following terms may appear in this manual): Warning: Warning indicates conditions or practices that could result in injury or loss of life. Caution: Caution indicates the conditions or practices that could result in damage to this...
Page 10 - Front Panel
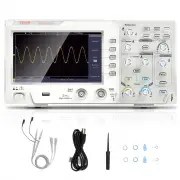
10 3. Quick Start Introduction to the Structure of theOscilloscope This chapter makes a simple description of the operation and function of the front panel of the oscilloscope, enabling you to be familiar with the use of the oscilloscope in the shortest time. Front Panel The front panel has knobs an...
Page 11 - Rear Panel; Figure 3- 2 Rear Panel
11 1. Display area2. Menu selection buttons: Select the right menu item.3. Control (button and knob) area4. Probe Compensation: Measurement signal (5V/1kHz) output.5. Signal Input Channel6. USB Host port: It is used to transfer data when external USB equipment connects to the oscilloscope regarded a...
Page 12 - Control Area
12 equipment connects to the oscilloscope regarded as "slave device".For example: to use this port when connect PC to the oscilloscope byUSB. Control Area Figure 3- 3 Control Area Overview 1. Function button area : Total 6 buttons. 2. Horizontal control area with 1 button and 2 knobs. "H...
Page 14 - User Interface Introduction; Figure 3- 4 Illustrative Drawing of Display Interfaces
14 User Interface Introduction 1 3 21 18 6 7 9 13 14 20 23 5 19 2 4 15 11 4 8 22 22 10 12 17 16 Figure 3- 4 Illustrative Drawing of Display Interfaces 1. Waveform Display Area.2. Run/Stop3. The state of trigger, including: Auto: Automatic mode and acquire waveform without triggering. Trig: Trigger d...
Page 16 - How to Implement the General Inspection
16 16. The frequency of the trigger signal.17. The readings show current sample rate.18. The readings indicate the corresponding Voltage Division and the Zero Point positions of the channels. "BW" indicates bandwidth limit. The icon shows the coupling mode of the channel. "—" indicat...
Page 17 - How to Implement the Function Inspection
17 If it is found that the packaging carton or the foamed plastic protection cushion has suffered serious damage, do not throw it away first till the complete device and its accessories succeed in the electrical and mechanical property tests. 2. Check the Accessories The supplied accessories have be...
Page 18 - How to Implement the Probe Compensation
18 menu. Select Adjust in the left menu, select Default in the right menu. The default attenuation coefficient set value of the probe in the menu is 10X. 2. Set the Switch in the Oscilloscope Probe as 10X and Connect the Oscilloscope with CH1 Channel. Align the slot in the probe with the plug in the...
Page 19 - Autoset; Figure; Overcompensated
19 make this adjustment to match the probe with the input channel. The probe which is not compensated or presents a compensation deviation will result in the measuring error or mistake. For adjusting the probe compensation, please carry out the following steps: 1. Set the attenuation coefficient of ...
Page 20 - How to Set the Probe Attenuation Coefficient; CH2 button
20 Figure 3- 7 Adjust Probe How to Set the Probe Attenuation Coefficient The probe has several attenuation coefficients, which will influence the vertical scale factor of the oscilloscope.To change or check the probe attenuation coefficient in the menu of oscilloscope:(1) Push the function menu butt...
Page 21 - How to Use the Probe Safely
21 Figure 3- 8 Attenuation Switch Caution: When the attenuation switch is set to 1X, the probe will limit the bandwidth of the oscilloscope in 5MHz. To use the full bandwidth of the oscilloscope, the switch must be set to 10X. How to Use the Probe Safely The safety guard ring around the probe body p...
Page 22 - How to Implement Self-calibration; Utility; Introduction to the Vertical System; Vertical Controls
22 Warning: To avoid electric shock, always keep your finger behind the safety guard ring of the probe during the operation.To protect you from suffering from the electric shock, do not touch any metal part of the probe tip when it is connected to the power supply.Before making any measurements, alw...
Page 24 - Introduction to the Horizontal System
24 helpful when the trace position is far out of the screen and want it to get back to the screen center immediately. 2. Change the Vertical Setting and Observe the Consequent State Information Change. With the information displayed in the status bar at the bottom of the waveform window, you can det...
Page 25 - Introduction to the Trigger System
25 status bar changes accordingly.2. Use the Horizontal Position knob to adjust the horizontal position of the signal in the waveform window. The Horizontal Position knob is used to control the triggering displacement of the signal or for other special applications. If it is applied to triggering th...
Page 27 - This chapter will deal with the following topics mainly:
27 4. Advanced User Guidebook This chapter will deal with the following topics mainly: How to Set the Vertical System How to Set the Horizontal System How to Set the Trigger System How to Set the Sampling/Display How to Save and Recall Waveform How to Implement the Auxiliary System Funct...
Page 28 - How to Set the Vertical System
28 How to Set the Vertical System The VERTICAL CONTROLS includes three menu buttons such as CH1 , CH2 and Math , and four knobs such as Vertical Position , Vertical Scale for each channel. Setting of CH1 and CH2 Each channel has an independent vertical menu and each item is set respectively based on...
Page 31 - Use Mathematical Manipulation Function; The Waveform Calculation
31 Use Mathematical Manipulation Function The Mathematical Manipulation function is used to show the results of the addition, multiplication, division and subtraction operations between two channels, or the FFT operation for a channel . Press the Math button to display the menu on the right. The Wav...
Page 32 - Using FFT function
32 1. Press the Math button to display the math menu in the right. The pink M waveform appears on the screen. 2. In the right menu, select Type as Math . 3. In the right menu, select Factor1 as CH1 . 4. In the right menu, select Sign as + . 5. In the right menu, select Factor2 as CH2 . 6. Press Next...
Page 37 - What is Nyquist frequency?; Use Vertical Position and Scale Knobs; Vertical Position
37 DC component or offset can cause incorrect magnitude values of FFT waveform. To minimize the DC component, choose AC Coupling on the source signal. To reduce random noise and aliased components in repetitive or single-shot events, set the oscilloscope acquisition mode to average. What is Nyqu...
Page 38 - How to Set the Horizontal System
38 Figure 4- 1 Information about Vertical Position How to Set the Horizontal System The HORIZONTAL CONTROLS includes the Horizontal HOR button and such knobs as Horizontal Position and Horizontal Scale . 1. Horizontal Position knob: this knob is used to adjust the horizontal positions of all channel...
Page 39 - Zoom the Waveform; Horizontal HOR; How to Set the Trigger System
39 Zoom the Waveform Push the Horizontal HOR button to enter wave zoom mode. The top half of the display shows the Main window and the bottom half displays the Zoom window. The Zoom window is a magnified portion of the Main window. In normal mode, the Horizontal Position and Horizontal Scale knobs a...
Page 40 - Trigger Control; Single Trigger
40 will acquire enough data continuously to draw the waveform on right of trigger point. Trigger control area consists of 1 knob and 2 menu buttons. Trigger Level : The knob that set the trigger level; push the knob and the level will be set as the vertical mid point values of the amplitude of the t...
Page 44 - How to Operate the Function Menu
44 Alternate Trigger (Trigger mode: Edge) Trigger signal comes from two vertical channels when alternate trigger is on. This mode is used to observe two unrelated signals. Trigger mode is edge trigger. Alternate trigger (Trigger Type: Edge) menu list: Menu Settings Instruction Type ALT Set vertical ...
Page 45 - and 2 immediate-execution; How to Set the Sampling/Display; Push the; Acquire; button, the Sampling and Display menu is shown
45 Utility, Measure, Acquire, Cursor, and 2 immediate-execution buttons: Autoset, Run/Stop. How to Set the Sampling/Display Push the Acquire button, the Sampling and Display menu is shown in the right as follows:
Page 46 - Persist
46 Persist When the Persist function is used, the persistence display effect of Function Menu Setting Description Acqu Mode Sample Peak Detect Average Normal sampling mode. Use to capture maximal and minimal samples. Finding highest and lowest points over adjacent intervals. It is used for the detec...
Page 47 - XY Format
47 the picture tube oscilloscope can be simulated. The reserved original data is displayed in fade color and the new data is in bright color.(1) Push the Acquire button. (2) In the right menu, press Persist to select the persist time, including OFF , 1 Second , 2 Seconds, 5 Seconds and Infinity . Wh...
Page 48 - Counter; How to Save and Recall a Waveform
48 2. Select XY Mode as ON or OFF in the right menu. Counter It is a 6-digit single-channel counter. The counter can only measure the frequency of the triggering channel. The frequency range is from 2Hz to the full bandwidth. Only if the measured channel is in Edge mode of Single trigger type, the c...
Page 49 - All
49 Source CH1 CH2 Math All Choose the waveform to be saved. (Choose All to save all the waveforms that are turned on. You can save into the current internal object address, or into USB storage as a single file.) Object ON OFF The object Wave0 –Wave15 are listed in the left menu, turn the M knob to c...
Page 51 - Save and Recall the Waveform
51 Function Menu Setting Description Function Save Display the save function menu Type Image Choose the saving type as image. Save Save the current display screen. The file can be only stored in a USB storage, so a USB storage must be connected first. The file name is editable. The file is stored in...
Page 52 - Save the current screen image:
52 Object as ON , the waveform stored in the address will be shown, the address number and relevant information will be displayed at the top left of the screen. In order to save the waveform of CH1 and CH2 into the USB storage as a BIN file, the operation steps should be followed:1. Turn on CH1 and ...
Page 53 - USB disk Requirements
53 The screen image can only be stored in USB disk, so you should connect a USB disk with the instrument.1. Install the USB disk : Insert the USB disk into the "7. USB Host port " of " Figure 3- 1 Front panel ". If an icon appears on the top right of the screen, the USB disk is insta...
Page 54 - Right click 1 or 2 red mark area, choose; Format; pop up a warning message, click; Set File System as FAT32, Allocation unit size 4096. Check; Perform a quick format; and then click; Yes; on the warning message.
54 Figure 4- 2: Disk Management of computer 4. Right click 1 or 2 red mark area, choose Format . And system will pop up a warning message, click Yes . Figure 4- 3: Format the USB disk warning 5. Set File System as FAT32, Allocation unit size 4096. Check " Perform a quick format " to execute ...
Page 55 - Figure 4- 4: Formatting the USB disk setting
55 Figure 4- 4: Formatting the USB disk setting 6. Formatting process. Figure 4- 5: Formatting the USB disk
Page 56 - Use Minitool Partition Wizard to format; Minitool Partition Wizard.
56 7. Check whether the USB disk is FAT32 with allocation unit size 4096 after formatting. Use Minitool Partition Wizard to format Download URL: http://www.partitionwizard.com/free-partition-manager.html Tip: There are many tools for the USB disk formatting on the market, just take Minitool Partitio...
Page 57 - at the top left of the menu. Then click; on the
57 4. Right click 1 or 2 red mark area, choose Format . Figure 4- 7: Choose format 5. Set File System FAT32, Cluster size 4096. Click OK . Figure 4- 8: Format setting 6. Click Apply at the top left of the menu. Then click Yes on the pop-up warning to begin formatting.
Page 59 - Config; ●Display
59 How to Implement the Auxiliary System Function Setting ● Config Push the Utility button, select Function in the right menu, select Configure in the left menu. The description of Configure Menu is shown as the follows: ●Display Push the Utility button, select Function in the right menu, select Dis...
Page 60 - Adjust
60 ● Adjust Push the Utility button, select Function in the right menu, select Adjust in the left menu. The description of Adjust Menu is shown as the follows: Function Menu Setting Description Function Display Show the display menu BackLight 0% - 100% Turn the M knob to adjust the backlight. Gratic...
Page 61 - Save; Update
61 Do Self Cal (Self-Calibration) The self-calibration procedure can improve the accuracy of the oscilloscope under the ambient temperature to the greatest extent. If the change of the ambient temperature is up to or exceeds 5 ℃ , the self-calibration procedure should be executed to obtain the highe...
Page 62 - How to Update your Instrument Firmware; USB disk
62 Use the front-panel USB port to update your instrument firmware using a USB memory device. Refer to " How to Update your Instrument Firmware " on page 62. How to Update your Instrument Firmware Use the front-panel USB port to update your instrument firmware using a USB memory device. USB ...
Page 63 - Start; How to Measure Automatically
63 6. In the right menu, select Start again, the interfaces below will be displayed in sequence. The update process will take up to three minutes. After completion, the instrument will be shut down automatically. 7. Press the button to power on the instrument. How to Measure Automatically Push the M...
Page 66 - Figure 4- 12 Automatic measurement; The automatic measurement of voltage parameters; The oscilloscopes provide automatic voltage measurements
66 Figure 4- 12 Automatic measurement The automatic measurement of voltage parameters The oscilloscopes provide automatic voltage measurements including Mean, PK-PK, RMS, Max, Min, Vtop, Vbase, Vamp, OverShoot, PreShoot, Cycle RMS, and Cursor RMS. Figure 4- 13 below shows a pulse with some of the vo...
Page 68 - The automatic measurement of time parameters
68 entire period of the waveform. Cursor RMS: The true Root Mean Square voltage over the range of two cursors. The automatic measurement of time parameters The oscilloscopes provide time parameters auto-measurements include Period, Frequency, Rise Time, Fall Time, +D width, -D width, +Duty, -Duty, D...
Page 69 - Other measurements
69 -D width: The width of the first negative pulse in the 50% amplitude points. +Duty: +Duty Cycle, defined as +Width/Period. -Duty: -Duty Cycle, defined as -Width/Period. Delay A→B : The delay between the two channels at the rising edge. Delay A→B : The delay between the two channels at the falling...
Page 70 - How to Measure with Cursors; The Cursor Measurement for normal mode:
70 and the unit is voltage-second. The area measured above the zero reference (namely the vertical offset) is positive; the area measured below the zero reference is negative. The area measured is the algebraic sum of the area of the whole waveform within the screen. Cycle Area : The area of the fir...
Page 72 - Auto Cursor
72 or b , turn the M knob to move it. 6. Push the horizontal HOR button to enter wave zoom mode. Push Cursor to show the right menu, select Window as Main or Extension to make the cursors shown in the main window or zoom window. Figure 4- 15 Time&Voltage Cursor Measurement Auto Cursor For the Au...
Page 73 - The Cursor Measurement for FFT mode
73 The Cursor Measurement for FFT mode In FFT mode, push the Cursor button to turn cursors on and display the cursor menu.The description of the cursor menu in FFT mode is shown as the following table: Functio n Menu Setting Description Type Vamp Freq Freq&Va mp AutoCursr Display the Vamp measur...
Page 75 - How to Use Executive Buttons
75 or b , turn the M knob to move it. 7. In the right cursor menu, you can select Window as Main to make the cursors shown in the main window. How to Use Executive Buttons Executive Buttons include Autoset, Run/Stop, Copy . [Autoset] button It's a very useful and quick way to apply a set of pre-se...
Page 76 - Judge waveform type by Autoset; Waveform; Description for some icons:
76 Judge waveform type by Autoset Five kinds of types: Sine, Square, video signal, DC level,Unknown signal.Menu as follow: Waveform Menu Sine Multi-period, Single-period, FFT, CancelAutoset Square Multi-period, Single-period, Rising Edge,Falling Edge, Cancel Autoset Video signal Type (line, field), ...
Page 77 - How to Save and Recall a
77 Notice: When there is no sampling at STOP state, the vertical division and the horizontal time base of the waveform still can be adjusted within a certain range, in other words, the signal can be expanded in the horizontal or vertical direction. When the horizontal time base is ≤50ms, the horizon...
Page 78 - Communication with PC; Install the software
78 5. Communication with PC The oscilloscope supports communications with a PC through USB. You can use the Oscilloscope communication software to store, analyze, display the data and remote control. To learn about how to operate the software, you can push F1 in the software to open the help documen...
Page 79 - Example 1: Measurement a Simple Signal; How to Set the
79 6. Demonstration Example 1: Measurement a Simple Signal The purpose of this example is to display an unknown signal in the circuit, and measure the frequency and peak-to-peak voltage of the signal. 1. Carry out the following operation steps for the rapid display of this signal: (1) Set the probe ...
Page 80 - Frequency; How to Set the Probe Attenuation
80 (5) In the left Type menu, turn the M knob to select Frequency . (6) In the right menu, select AddCH1 . The frequency type is added. The measured value will be displayed at the bottom left of the screen automatically (see Figure 6- 1 ). Figure 6- 1 Measure period and frequency value for a given s...
Page 81 - Coefficient
81 Coefficient " on P20). Connect the oscilloscope CH1 channel with the circuit signal input end and the CH2 channel to the output end. Operation Steps: (1) Push the Autoset button and the oscilloscope will automatically adjust the waveforms of the two channels into the proper display state. (2)...
Page 82 - Example 3: Capturing a Single Signal; The operation steps are as follows:
82 Figure 6- 2 Waveform of Gain Measurement Example 3: Capturing a Single Signal It's quite easy to use Digital Oscilloscope to capture non-periodic signal, such as a pulse and burr etc. But the common problem is how to set up a trigger if you have no knowledge of the signal? For example, if the pul...
Page 84 - Example 4: Analyze the Details of a Signal
84 making an easy observation of the waveform before the burr occurs (see Figure 6- 3 ). Figure 6- 3 Capturing a Single Signal Example 4: Analyze the Details of a Signal Noise is very common inside most of the electronic signal. To find out what's inside the noise and reduce the level of noise is ve...
Page 86 - Examine the Phase Difference between Signals of two Channels; of X-Y coordinate graph, please operate according to the following
86 easy to see more details of the signal itself. After applying Average, user can easily identify the burrs on the rising and falling edges of some part of the signal (see Figure 6- 5 ). Figure 6- 5 Reduce Noise level by using Average function Example 5: Application of X-Y Function Examine the Phas...
Page 89 - Example 6: Video Signal Trigger
89 Example 6: Video Signal Trigger Observe the video circuit of a television, apply the video trigger and obtain the stable video output signal display. Video Field Trigger For the trigger in the video field, carry out operations according to the following steps: (1) Push the Trigger Menu button to ...
Page 90 - Figure 6- 7 Waveform Captured from Video Field Trigger
90 Figure 6- 7 Waveform Captured from Video Field Trigger
Page 92 - How to Set; , or a longer duration is set in
92 the proper position. Only if a proper trigger mode is applied, the waveform can be displayed steadily. 5. No Display Responses to the Push-down of Run/Stop. Check whether Normal or Signal is chosen for Polarity in the TRIG MODE menu and the trigger level exceeds the waveform range. If it is, make...
Page 93 - Technical Specifications; How to; Performance Characteristics
93 8. Technical Specifications Unless otherwise specified, the technical specifications applied are for the oscilloscope only, and Probes attenuation set as 10X. Only if the oscilloscope fulfills the following two conditions at first, these specification standards can be reached. This instrument s...
Page 97 - General Technical Specifications; Display
97 Performance Characteristics Instruction Edge trigger slope Rising, Falling Video Trigger Modulation Support standard NTSC, PAL and SECAM broadcast systems Line number range 1-525 (NTSC) and 1-625 (PAL/SECAM) General Technical Specifications Display Display Type 7" Colored LCD (Liquid Crystal ...
Page 99 - Standard Accessories:; Appendix B: General Care and Cleaning; General Care
99 9. Appendix Appendix A: Enclosure (The accessories subject to final delivery.) Standard Accessories: Power Cord CD Rom Quick Guide USB Cable Probe Probe Adjust Options: Soft Bag Appendix B: General Care and Cleaning General Care
Page 100 - Cleaning
100 Do not store or leave the instrument where the liquid crystal display will be exposed to direct sunlight for long periods of time. Caution: To avoid any damage to the instrument or probe, do not exposed it to any sprays, liquids, or solvents. Cleaning Inspect the instrument and probes as often a...
Page 102 - REP
102 Made In China Address: Baoshanqu Shuangchenglu 803long 11hao 1602A-1609shi Shanghai Imported to AUS: SIHAO PTY LTD, 1 ROKEVA STREETEASTWOOD NSW 2122 Australia Imported to USA: Sanven Technology Ltd., Suite 250, 9166 Anaheim Place, Rancho Cucamonga, CA 91730 REP EC SHUNSHUN GmbHRömeräcker 9 Z2021...


 VEVOR QXBFZDBKCWAC4S5LHV0
User Manual
VEVOR QXBFZDBKCWAC4S5LHV0
User Manual
 VEVOR QXBFZDKCWAC60TQ7CV0
User Manual
VEVOR QXBFZDKCWAC60TQ7CV0
User Manual
 VEVOR QXBFZDKCWACDC2IU7V0
User Manual
VEVOR QXBFZDKCWACDC2IU7V0
User Manual
 VEVOR QXBFZDKCWACDCBUUBV0
User Manual
VEVOR QXBFZDKCWACDCBUUBV0
User Manual
 VEVOR QXBQZDKCWACDCAVNGV0
User Manual
VEVOR QXBQZDKCWACDCAVNGV0
User Manual
 VEVOR SBQCG40000005810NV1
User Manual
VEVOR SBQCG40000005810NV1
User Manual
 VEVOR ZD400010A600VL55YV0
User Manual
VEVOR ZD400010A600VL55YV0
User Manual
 VEVOR ZD600010A600VXDM7V0
User Manual
VEVOR ZD600010A600VXDM7V0
User Manual